4 min read · Pleroma Commerce · 3 sources
In short
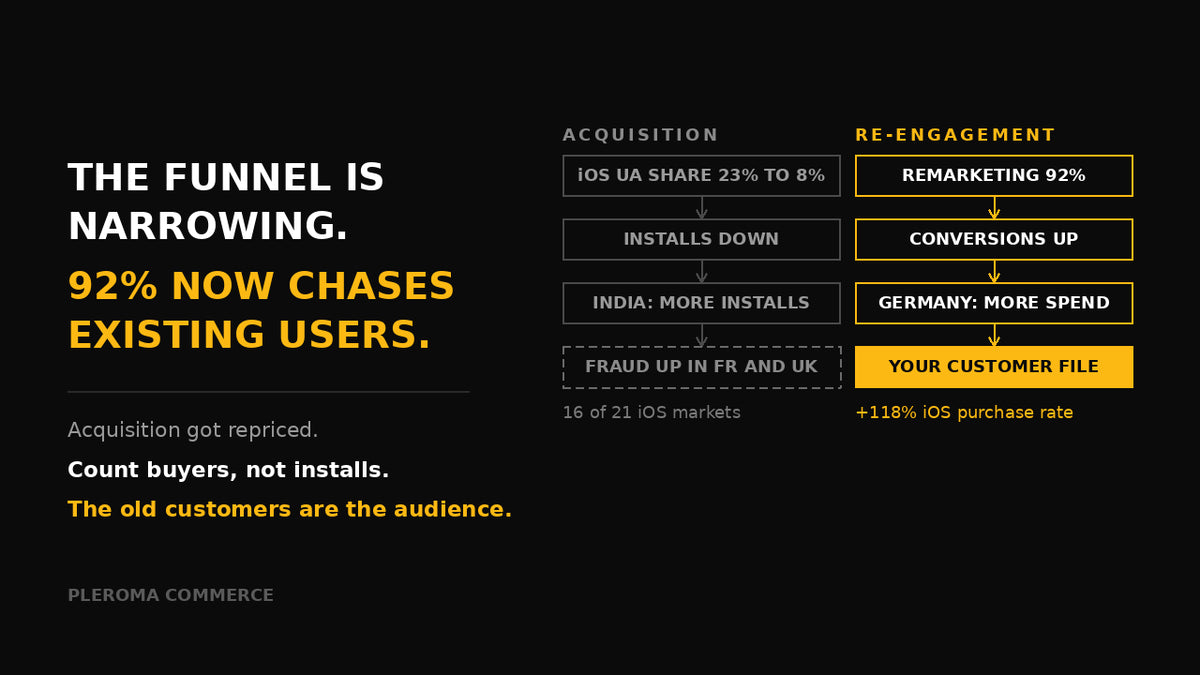
Remarketing rose from 77% to 92% of iOS e-commerce ad spend in one year, and to 85% on Android. Acquisition got more expensive after China-based advertisers pulled back from the US, and remarketing lifts install-to-purchase conversion by 118% on iOS. Install growth is not revenue growth: India gained installs and lost spend share, while Germany and the UK gained. For a Shopify store without an app, the same logic applies to the customer file: build retention and tracking before scaling ad spend.
In this article
For a decade the e-commerce growth plan had one line: buy new users, convert a share of them, repeat. The latest AppsFlyer dataset suggests that line has stopped paying. Across 1,800 e-commerce apps and 5.5 billion dollars of ad spend between October 2024 and March 2026, the share of iOS budgets going to remarketing, campaigns aimed at people who already installed the app, rose from 77% to 92% in a year[1]. On Android it reached 85%.
Acquisition did not disappear. It got priced out. Paid installs fell on iOS in 16 of 21 markets, and in every one of those 16, remarketing conversions grew at the same time[1]. In Germany installs dropped 48% while remarketing conversions rose 53%. In the US the figures were minus 37% and plus 15%.
Where the money went, and why
Part of the shift is geopolitics. In 2025 China-based apps accounted for 85% of worldwide iOS user acquisition spend and had started moving budgets from the US to Western Europe; iOS acquisition in Germany rose 170% year on year between January and May 2025[2]. The trigger was the end of duty-free de minimis treatment for low-value parcels from China on 2 May 2025[3]. By Q4 2025, US iOS acquisition spend was 57% lower than a year earlier[1]. When the largest buyer of new users leaves an auction, the auction does not become cheap for everyone else. It becomes thin, and the advertisers who stay spend on the audience they can already reach.
The other part is arithmetic. Remarketing lifts the install-to-purchase conversion rate by 118% on iOS and 177% on Android[1]. Acquisition buys a chance. Remarketing buys a second visit from someone who has already chosen you once.
One caveat on the base rate: this is app data. The sample covers apps with at least 3,000 installs a month per country, with marketplaces and grocery excluded. It describes brands large enough to run an app programme, not the average Shopify store.
Volume is not value
The most useful finding in the report is the gap between users and revenue. India led install and remarketing growth on both platforms and still lost share of consumer spend: 14% on Android, 19% on iOS[1]. Germany went the other way. Its share of in-app consumer spend grew 40% on Android and 22% on iOS, the most consistent gain in the dataset, and the UK grew 14% and 17%.
For a US or UK brand deciding where to go in Europe, that is the relevant signal. Install volume shows where users are cheap. Spend share shows where they pay.
Fraud follows the expensive traffic
Global iOS install fraud fell from 16.6% to 11.0% between Q1 2025 and Q1 2026. In the two Western markets where each install costs most, it nearly doubled: France went from 11.8% to 23.0%, the UK from 11.4% to 20.0%[1]. Affiliate traffic peaked at 41.2% fraud in Q4 2025, the season when brands onboard new networks fastest. The self-reporting networks, Google, Meta, TikTok, Apple and Snap, sat at 0.9%.
The lesson is not to avoid affiliates. It is that a holiday budget scaled through new, unvetted sources in France or the UK buys a fifth of its installs from nobody.
What this means for a brand without an app
Most Shopify brands have no app, so the 92% figure does not apply to them directly. The mechanism does. For a web store, the installed base is the customer file: the email and SMS list, the past buyers, the people who left a review. When acquisition auctions thin out and get noisier, that file becomes the cheapest audience a brand owns.
Price the retention channel before the acquisition one. If the email and SMS flows are not built, extra ad budget buys customers you cannot reach a second time.
Count buyers, not visitors. India's install growth alongside a falling spend share is what a traffic report looks like when nobody checks the revenue line.
Audit sources before Q4. Every network added in November is a network with no history.
Ask the tools better questions. Of more than 8,000 AI analytics queries from nearly 400 e-commerce brands, only 4% of performance questions were diagnostic: anomalies, causes, recommendations[1]. The rest were lookups. A faster lookup does not tell you why a market stopped converting.
At Pleroma we build the tracking and retention layer before any ad budget is scaled, for exactly this reason.
The top of the funnel has not closed. It has been repriced. The question for Q4 is not how many new customers you can buy. It is how many of the old ones you can still reach.
Pleroma Commerce
Retention and tracking before ad spend
Every engagement starts with a five-day audit of the store and every channel it sells through.
See the store and channel audit →Sources
- AppsFlyer, "The State of eCommerce for Marketers, 2026 Edition", May 2026. appsflyer.com
- AppsFlyer, "Tariff Turmoil Sparks eCommerce Budget Shift as Global UA Spend Hits $4.6B", Business Wire, July 2025. businesswire.com
- The White House, "Fact Sheet: President Donald J. Trump Closes De Minimis Exemptions to Combat China's Role in America's Synthetic Opioid Crisis", April 2025. whitehouse.gov